Task 1 – Temporal Action Proposals

In many large-scale video analysis scenarios, one is interested in localizing and recognizing human activities occuring in short temporal intervals within long untrimmed videos. Current approaches for activity detection still struggle to handle large-scale video collections and efficiently addressing this task remains elusive to our visual systems. This is in part due to the computational complexity of current action recognition approaches and the lack of methods that propose fewer intervals in the video, where activity processing can be focused. These set of candidate temporal segments are widely known as Action Proposals.

To be applicable at large-scales and in practical scenarios, a useful action proposal method is driven by two competing goals. (i) The proposal method must be computationally efficient, in representing, encoding, and scoring a temporal segment. (ii) The proposal method must be discriminative of activities that we are interested in, so as to only retrieve temporal segments that contain visual information indicative of these activity classes. Thus, this task is intended to push the state-of-the-art in action proposal generation algorithms forward.

For information related to this task, please contact: fabian.caba@kaust.edu.sa, humam.alwassel@kaust.edu.sa, victor.escorcia@kaust.edu.sa

Dataset

The ActivityNet Version 1.3 dataset will be used for this challenge. The dataset consists of more than 648 hours of untrimmed videos from a total of ~20K videos. It contains 200 different daily activities such as: 'walking the dog', 'long jump', and 'vacuuming floor'. The distribution among training, validation, and testing is ~50%, ~25%, and 25% of the total videos respectively. The dataset annotations can be downloaded directly from here .

Evaluation Metric

The evaluation code used by the evaluation server can be found here.

We use the area under the Average Recall vs. Average Number of Proposals per Video (AR-AN) curve as the evaluation metric for this task. A proposal is a true positive if it has a temporal intersection orver union (tIoU) with a ground-truth segment that is greater than that or equal to a given threshold (e.g, \( \text{tIoU} > 0.5 \)). AR is defined as the mean of all recall values using \( \text{tIoU} \) between \( 0.5 \) and \( 0.9 \) (inclusive) with a step size of \( 0.05 \). AN is defined as the total number of proposals divided by the number of videos in the testing subset. We consider 100 bins for AN, centered at values between 1 and 100 (inclusive) with a step size of 1, when computing the values on the AR-AN curve.

The specific process in which the submission files are scored using this evaluation metric:

Let $$\text{AN}_{\text{submission}} = \frac{\text{total number of proposals in the submission file}}{\text{total number of videos in the testing subset}} $$ and \( \text{AN}_{\text{max}} \) be the maximum average number of proposals per video used in evaluation metric. Here, \( \text{AN}_{\text{max}} = 100 \). Let \( R = \frac{\text{AN}_{\text{max}}}{\text{AN}_{\text{submission}}} \), then we pre-process the submission file in the following way:

  • If \( R < 1 \), then for each video in the testing subset, we sort its proposals with respect to the proposal score and discard the lowest scoring \( R\% \) proposals.
  • If \( R \geq 1 \), then for each video in the testing subset, we sort its proposals with respect to the proposal score and replicate the lowest scoring \( (R - 1)\% \) proposals from each video, and add the resulting data point on the AR-AN curve. The area under the resulting final curve is then computed and reported as the metric score for the submission file.

The resulting filtered submission file will have an \( \text{AN} = \text{AN}_\max \). For each value \( p \) from \( 1 \) to \( 100 \) in steps of \( 1 \), we compute \( AR \) using only the top scoring \( p \% \) proposals from each video, and add the resulting data point on the AR-AN curve. The area under the resulting final curve is then computed and reported as the metric score for the submission file.

Baselines

We provide the results for a baseline proposal method (named Uniform Random) on the validation subset. Uniform Random: the center and length of each proposal are independently drawn from a uniform random distribution over the interval \( [0,d] \), where \( d \) is the video duration. This model scores \( 44.88\% \) on the metric described above.

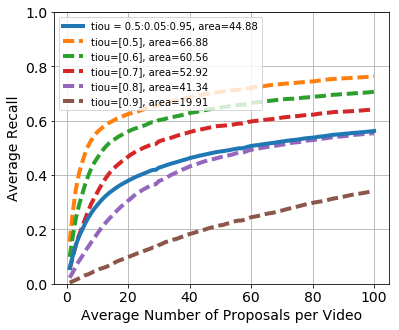
The dashed lines are for the recall performance when averaging over a single tIoU threshold, while the solid line is the average recall across all \( \text{tIoU} \) thresholds. As we can see, the recall performance is high for the smaller tIoU thresholds like \( 0.5 \) and \( 0.6 \), but it drops drastically for higher \( \text{tIoU} \)thresholds such as \( 0.8 \) and \( 0.95 \). Therefore, for a proposal method to score high on the evaluation metric, it would need to focus on getting relatively high recall for both low and high tIoU thresholds. Further reading can be found in this notebook.

Getting started

To encourage the participation on this task, we team up with other researchers to make the following resources available:

RGB frames extracted at 5FPS (~200GB).

Frame-level features for the frames above (~89GB).

Please take a look at the README for more details.

Submission Format

Please use the following JSON format when submitting your results for the challenge:

              {
  version: "VERSION 1.3",
  results: {
    "5n7NCViB5TU": [
      {
        score: 0.64,
        segment: [24.25,38.08]
      },
      {
        score: 0.77,
        segment: [11.25, 19.37]
      }
    ]
  }
  external_data: {
    used: true, # Boolean flag. True indicates the use of external data.
    details: "First fully-connected layer from VGG-16 pre-trained on ILSVRC-2012 training set", # This string details what kind of external data you used and how you used it.
  }
}


The example above is illustrative. Comments must be removed in your submission. You can download here a sample submission file.